Hectosky: Multi-Fiber Sky Subtraction
Hectosky is an an interactive, IDL-based pipeline for sky subtraction in multi-fiber spectroscopy, designed to remove background nebular emission lines while maximizing overall signal-to-noise.
The source code is available on GitHub along with complete instructions for installation and use.
Hectosky was specifically written for data taken with the Hectospec multi-fiber spectrograph (hence the name), and particularly for data reduced with Juan Cabanela's E-SPECROAD pipeline, but its algorithm can be adapted for use with data from other instruments.
Why Optimize Sky Subtraction?
One of the final steps in reducing spectroscopic data is subtracting off all the light coming from stuff between your telescope and your astronomical target. Earth's atmosphere makes a big contribution to this "sky" background, both by scattering back human-made light pollution and by producing its own airglow (such as OH line emission).
There may also be light coming from your target's immediate surroundings in space, particuarly if your target lies within an emission nebula. The low-density ionized gas produces many bright optical lines, which can vary in strength across relatively small spatial scales.
When you're using a slit spectrograph, you automatically get a spectrum of the sky immediately adjacent to your target during the same exposure. With fiber spectrographs, you have two choices:
- Point a handful of fibers at blank sky during any given exposure, then combine the results into an average sky spectrum. Good for relatively unifom sky backgrounds.
- Add a dedicated sky exposure, offset by 3-5", for each target field. Good for complex sky backgrounds, but doubles your total observing time.
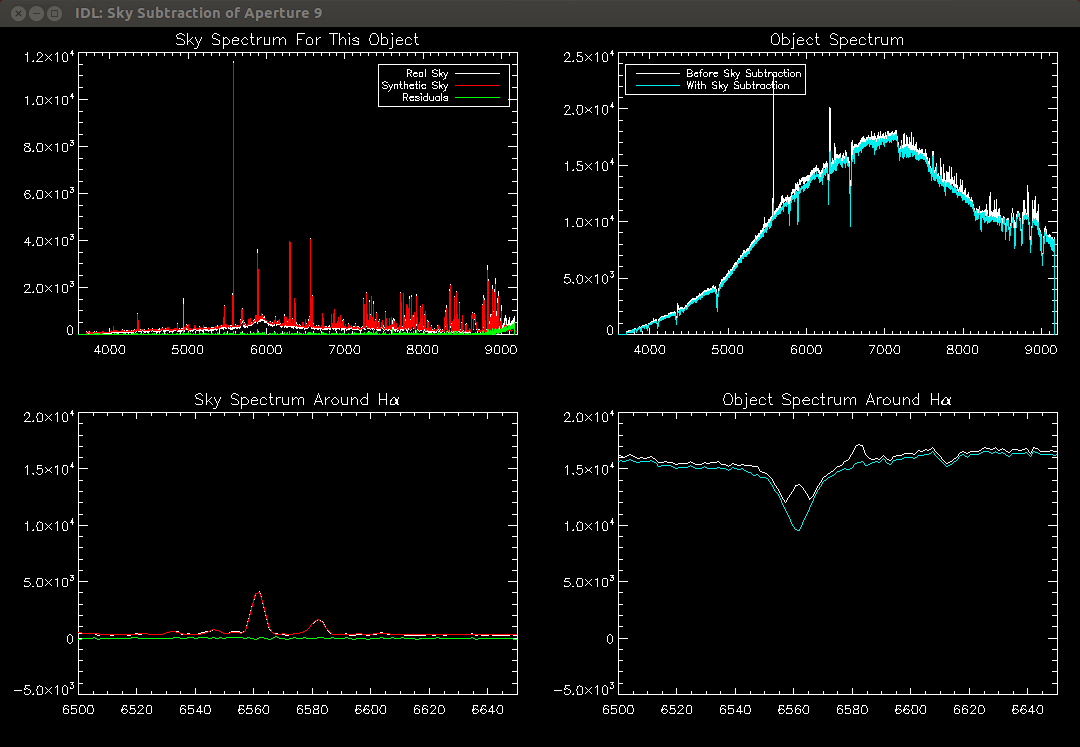
Hectosky gets you the benefits of a dedicated sky exposure without the expensive telescope time. It fits a set of common nebular emission lines in the closest sky spectrum, while using an average sky spectrum for all other wavelengths.
For more details, refer to Section 2.3 of Kiminki et al. 2015. Figure 4 and Figure 5 illustrate the benefits of using the Hectosky algorithm.